How to use Katib UI
This page describes how to access and use Katib UI. Follow the installation page to install Katib control plane before accessing Katib UI.
You can use the Katib user interface (UI) to submit Katib Experiments and to monitor your Experiments results.
Accessing Katib UI from Kubeflow Central Dashboard
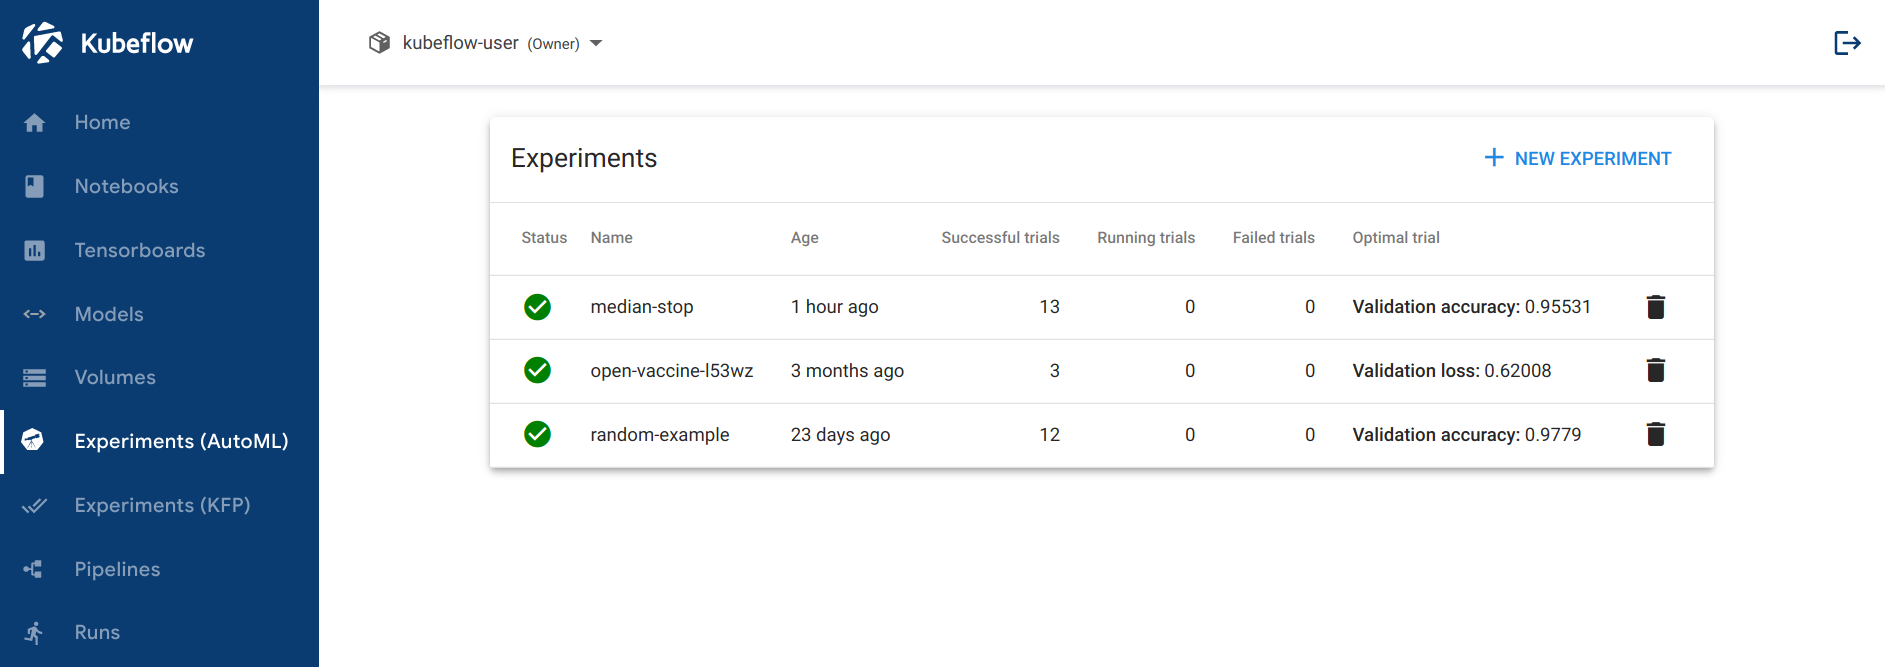
If you install Katib as part of Kubeflow platform, you can access Katib UI via Kubeflow Central Dashboard. Click Experiments (AutoML) in the left-hand menu:
Accessing Katib UI Standalone
You can access Katib UI standalone without Kubeflow Central Dashboard. For that, port-forward the Katib UI service:
kubectl port-forward svc/katib-ui -n kubeflow 8080:80
Use this URL to access Katib UI:
http://localhost:8080/katib/
You need to select namespace to view Katib Experiments:

Running Hyperparameter Tuning Experiment from Katib UI
You can submit an hyperparameter tuning Experiment from the Katib UI.
Create Katib Experiment
Click New Experiment on the Katib home page.
You should be able to view tabs offering you the following options:
Metadata: Type name of your Experiment.
Trial Thresholds: Choose how many Trials you want to run.
Objective: Add metrics that you want to optimize and type of optimization.
Search Algorithm: Select hyperparameter tuning algorithm and configure algorithm settings.
Early Stopping: Add early stopping algorithm if that is required.
Hyper Parameters: Add hyperparameters and search space that you want to optimize.
Metrics Collector: Modify metrics collector type if that is required.
Trial Template: Configure parameters for your Trial template. Every hyperparameter must have reference to the
trialParametersvalues.
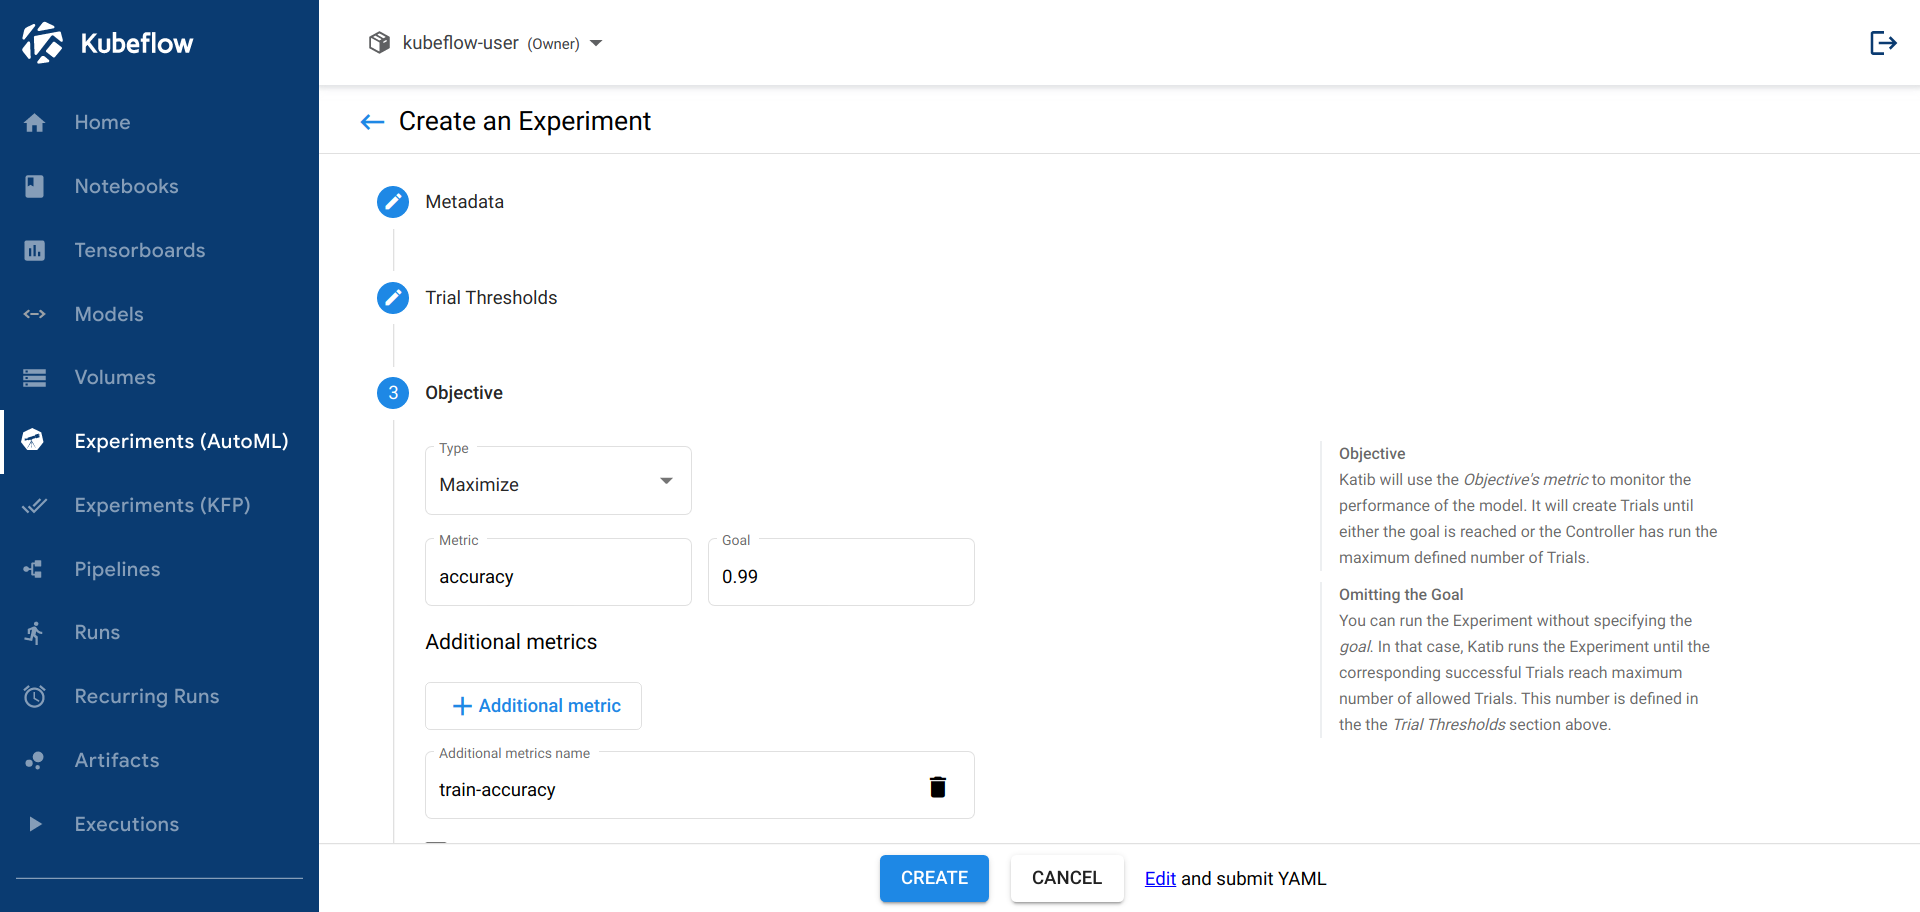
(Optional) If you want to modify Experiment YAML, you can click edit and submit YAML at the bottom.
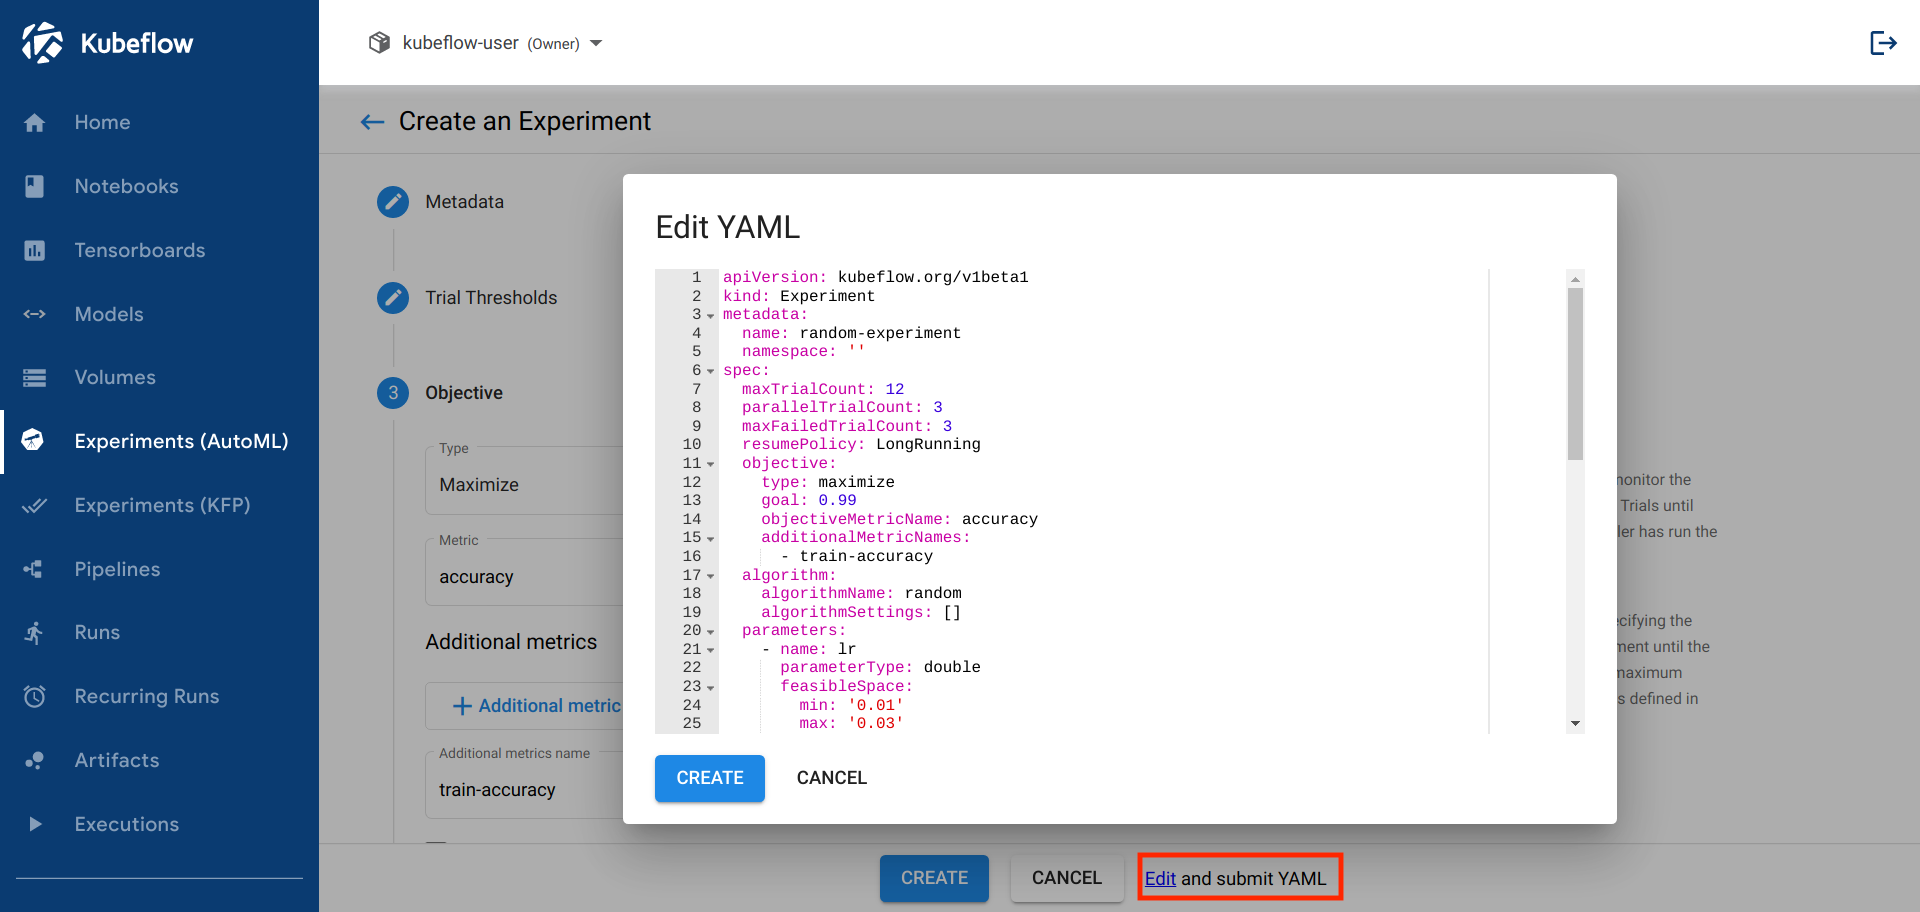
Create Katib Experiment.
Get Katib Experiment Results
Follow these steps to get Katib Experiment results:
You should be able to view the list of Experiments on Katib UI home page:

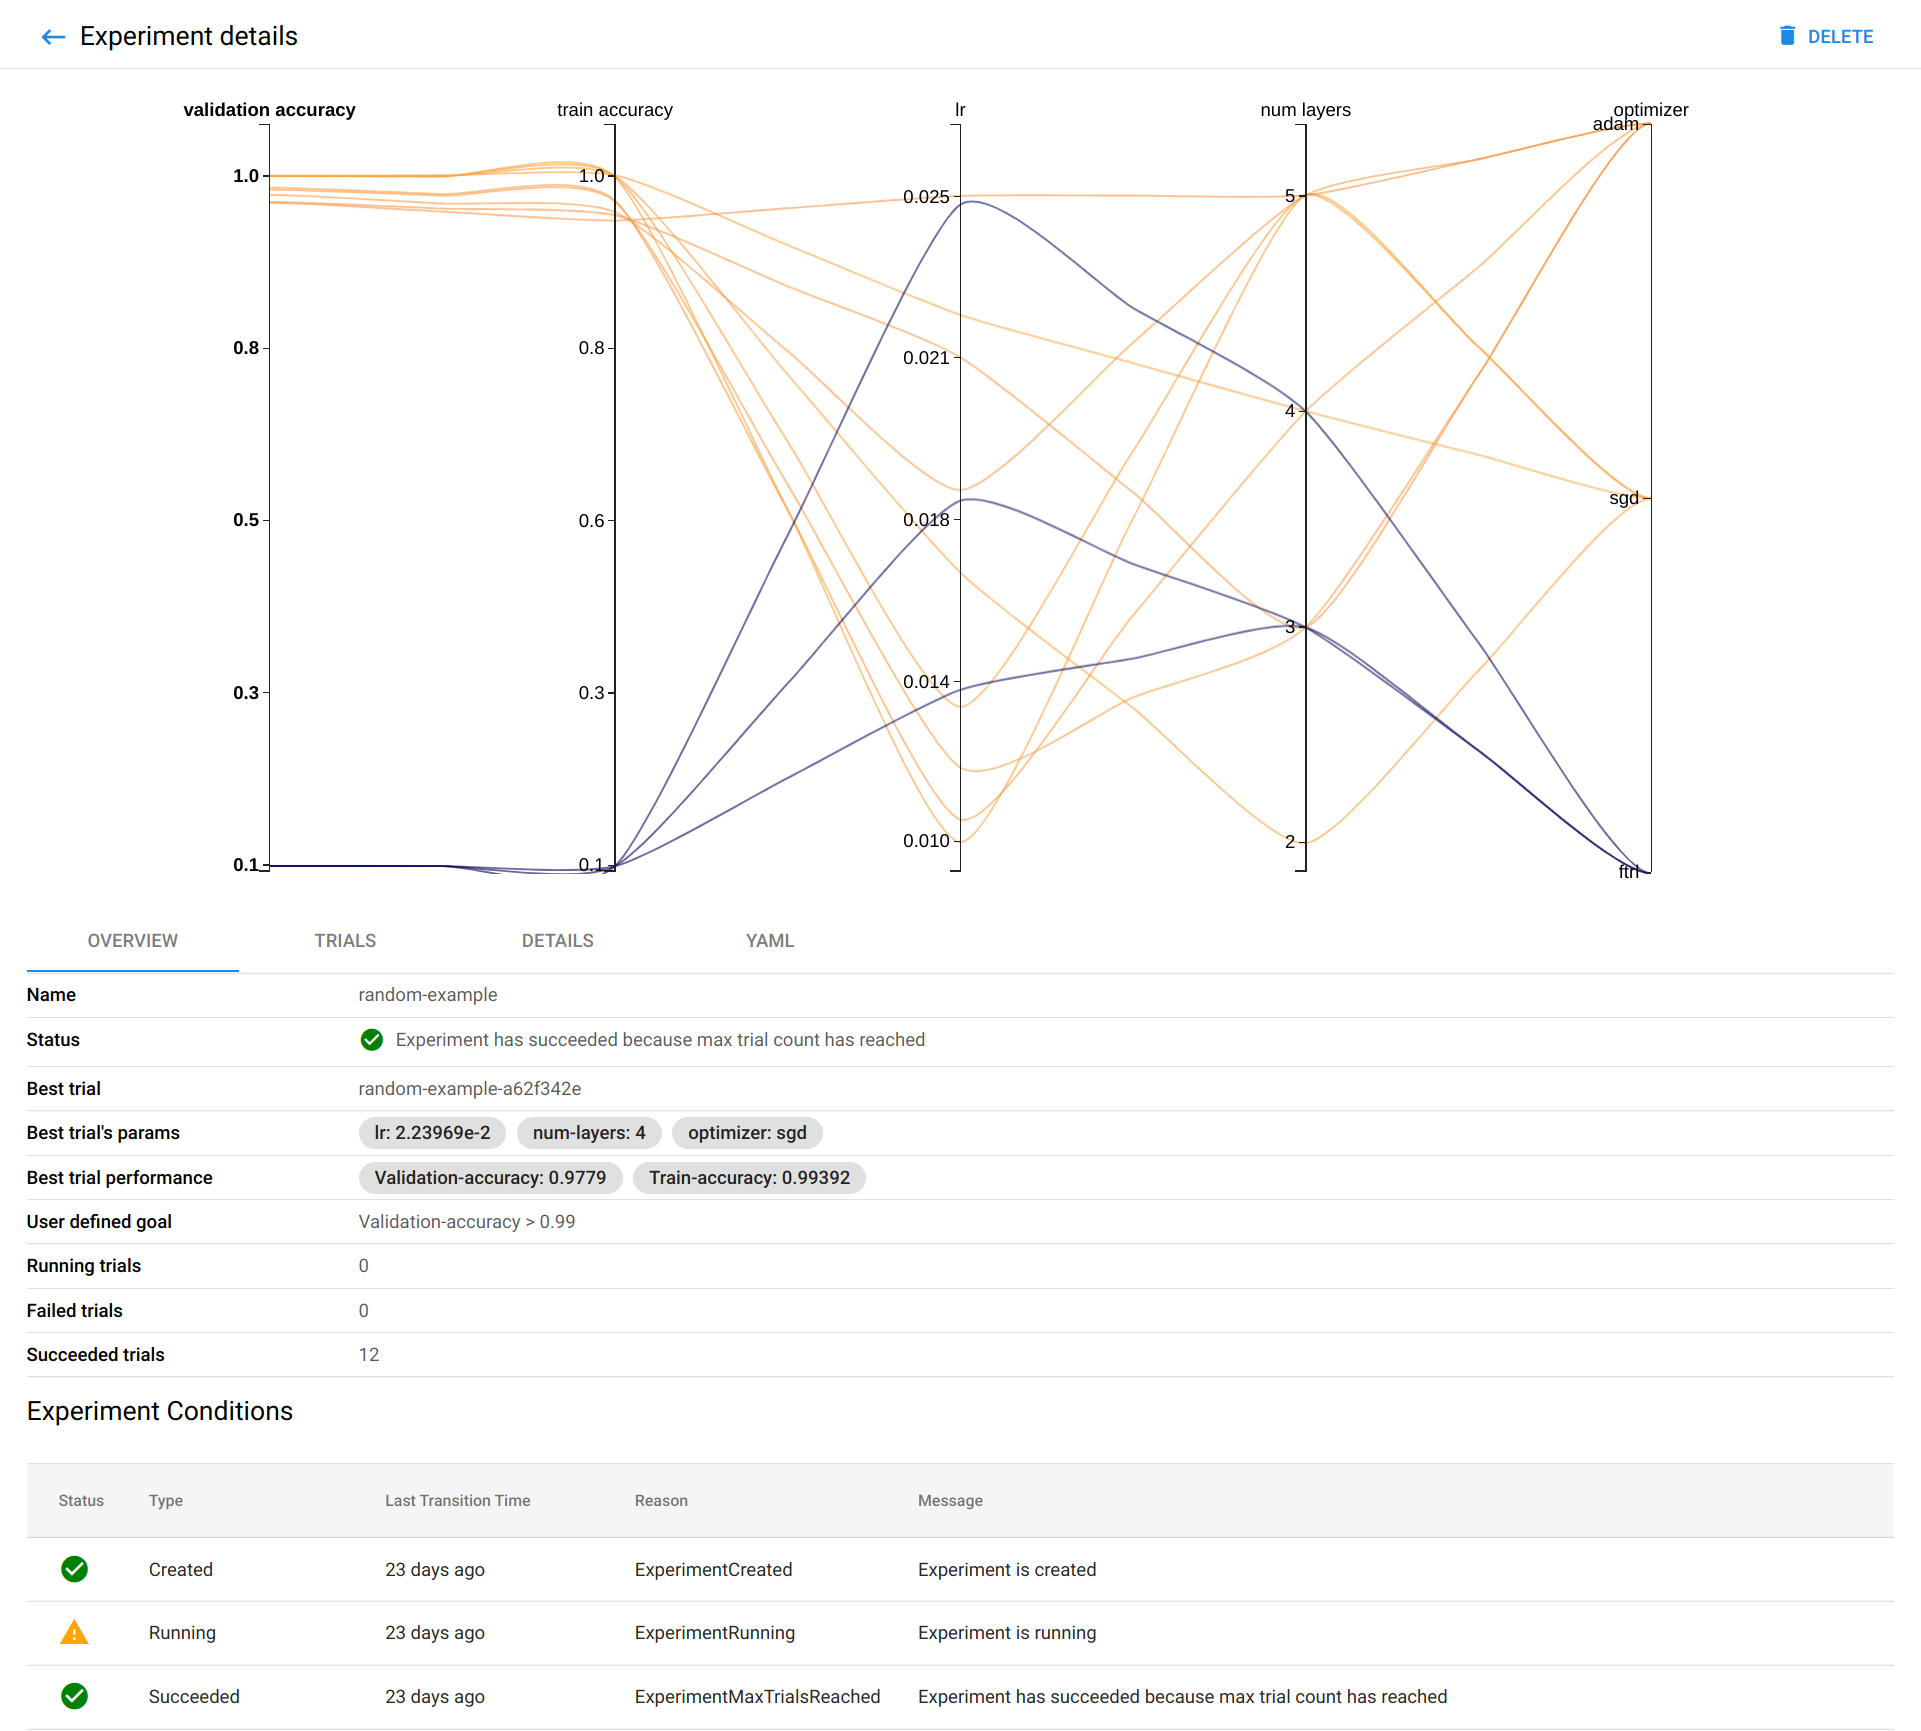
Click the name of your Experiment. For example, click random-example.
There should be a graph showing the level of validation and train accuracy for various combinations of the hyperparameter values (learning rate, number of layers, and optimizer):
If you click to the Trials tab, you will see list of Trials that ran withing the Experiment.
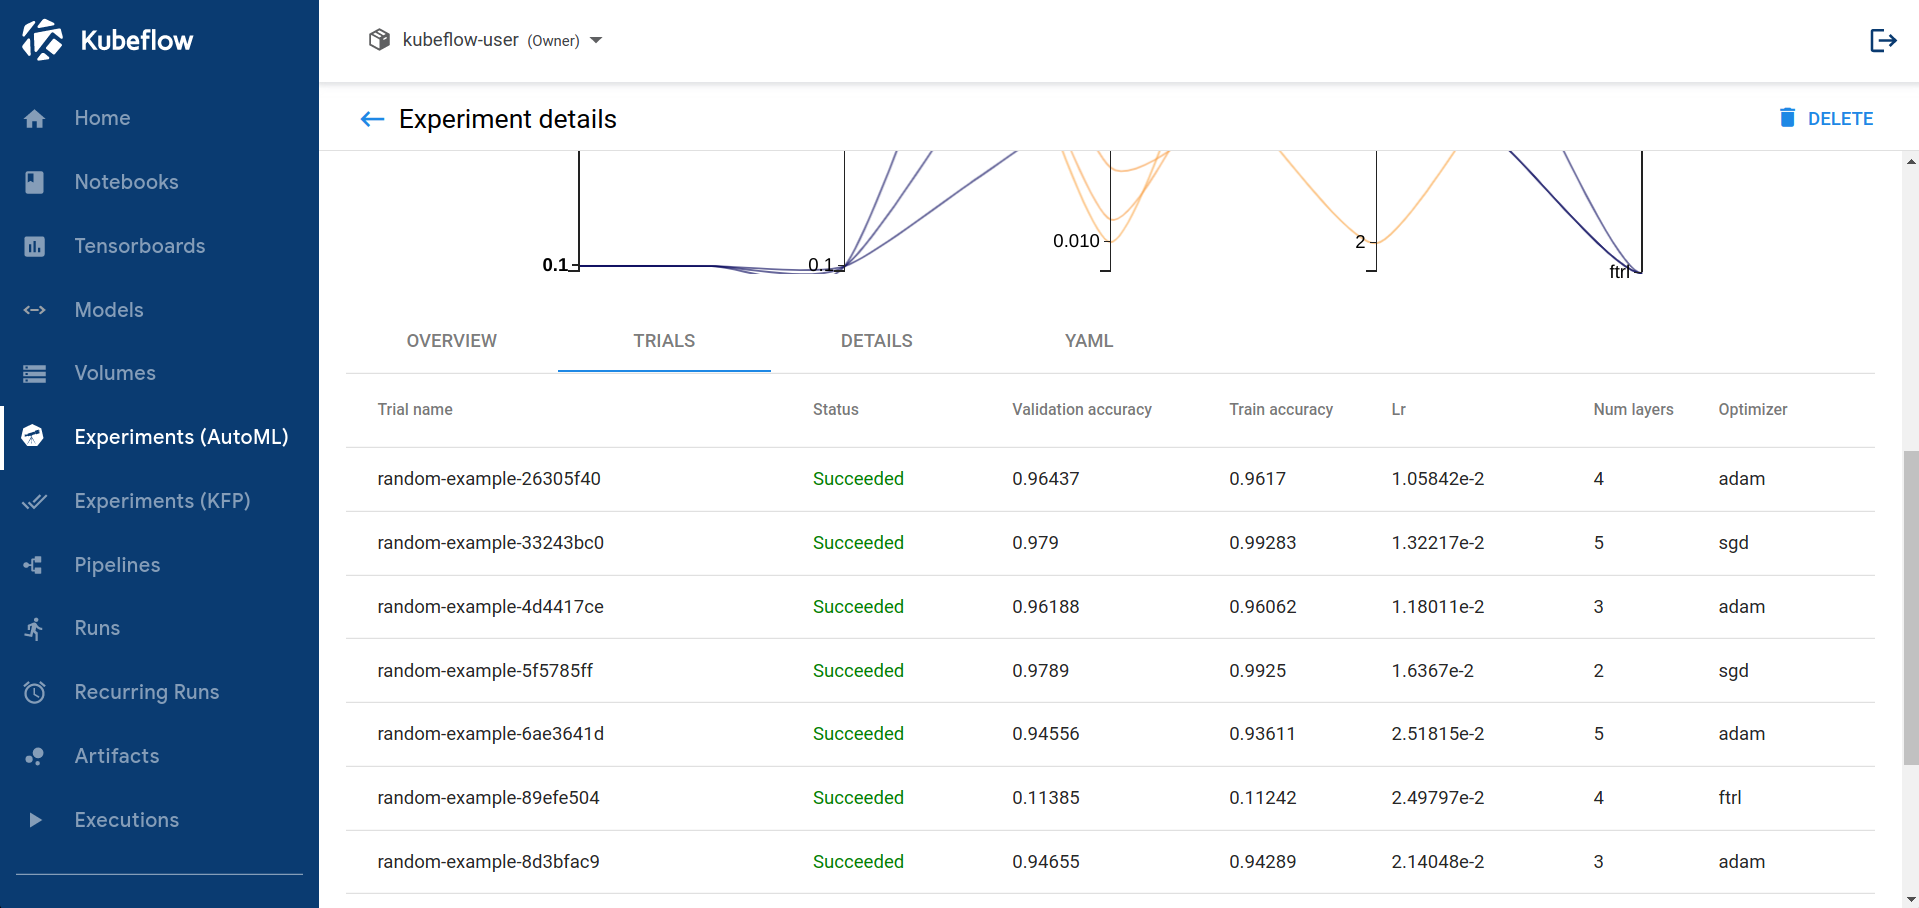
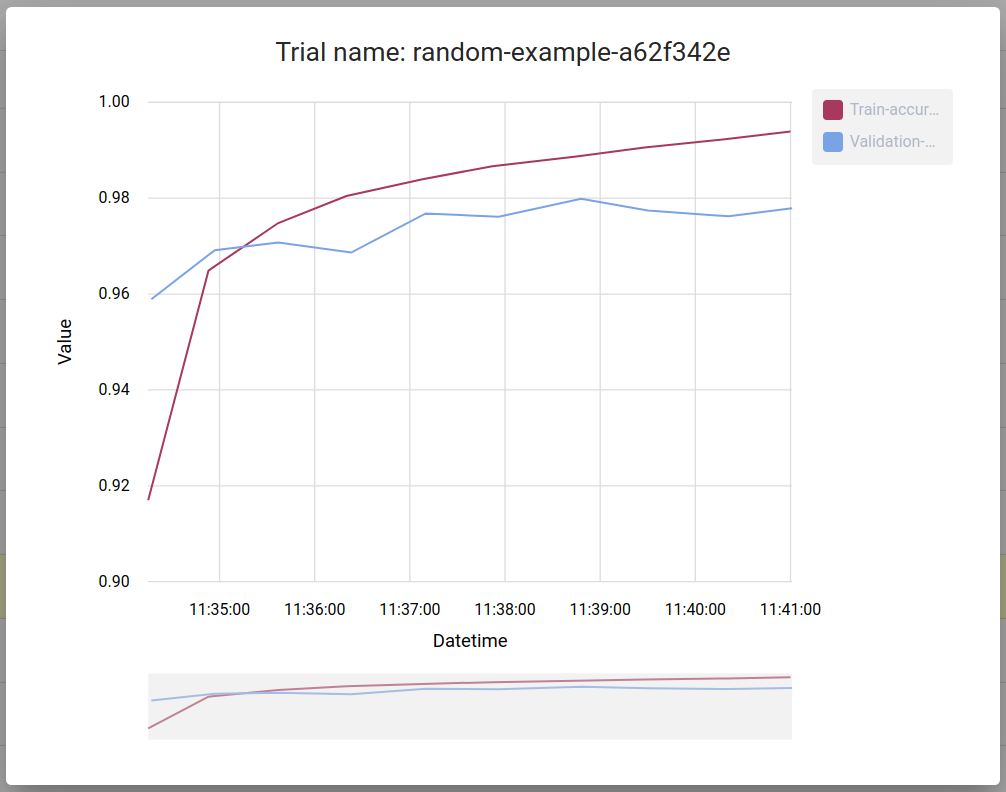
You can click on Trial name to get metrics for the particular Trial:
Create Katib Experiment with Early Stopping
Follow this guide to learn how early stopping works in Katib.
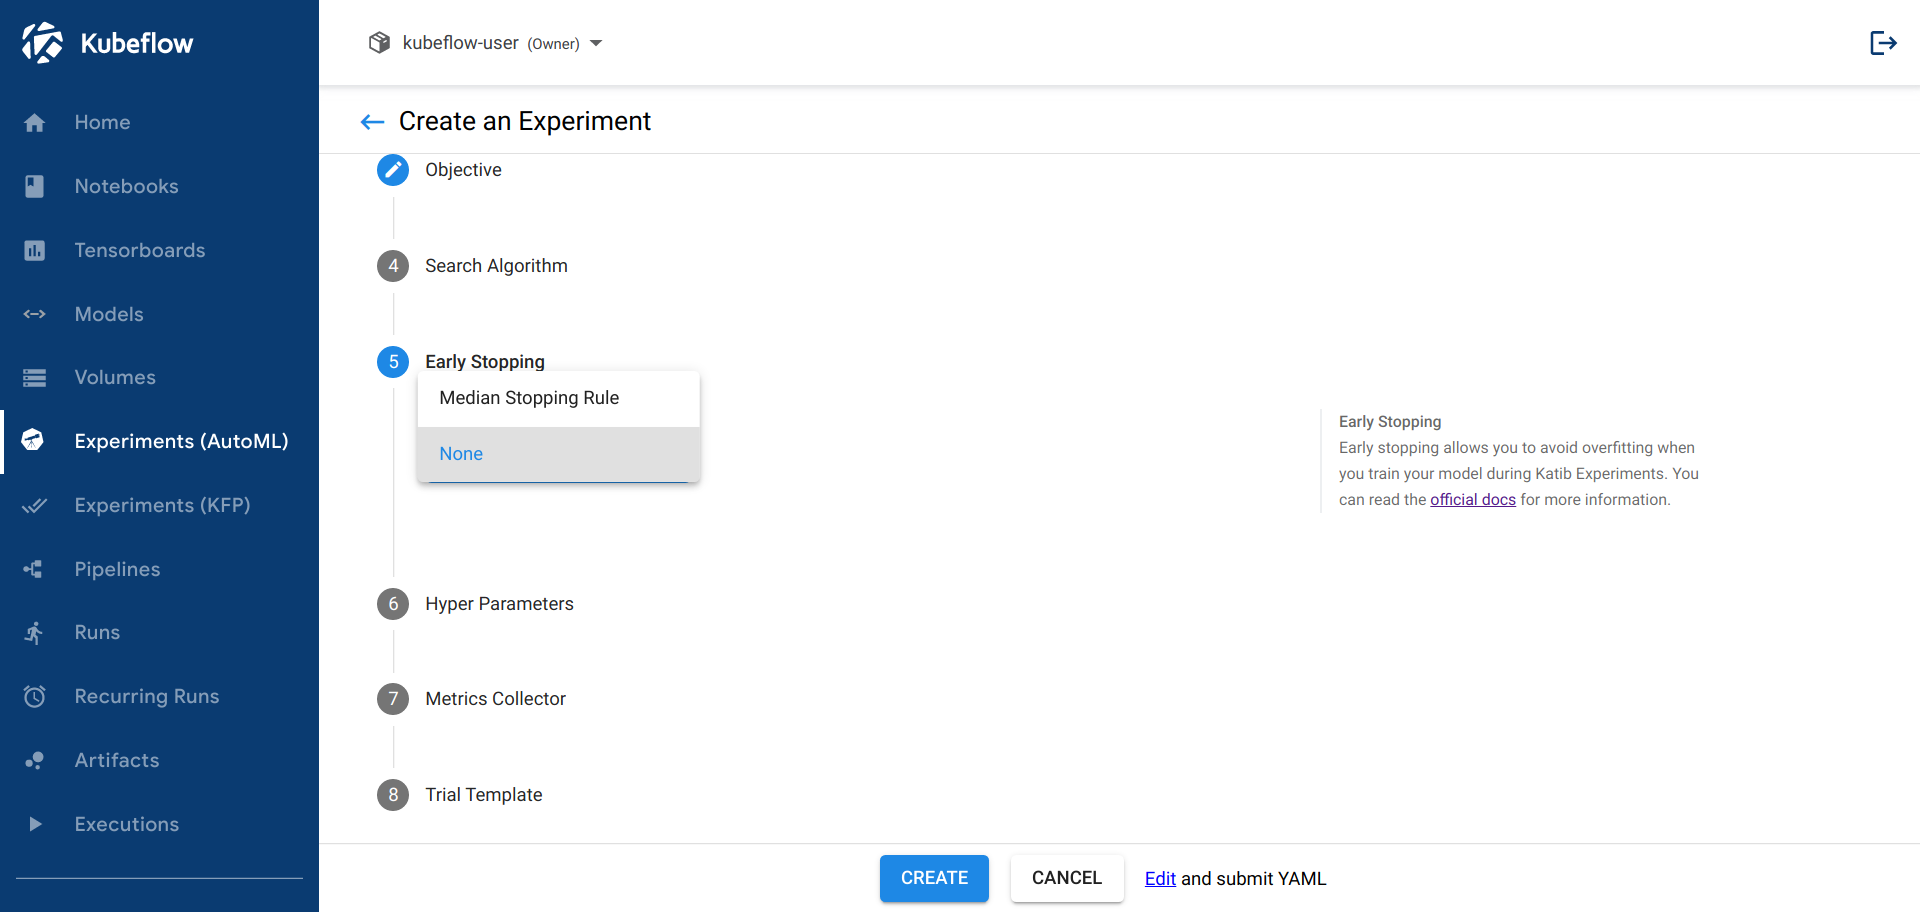
Select early stopping algorithm while creating Katib Experiment:
After your Experiment is complete, you can check your results in the Katib UI. The Trial statuses on the Experiment monitor page should look as follows:
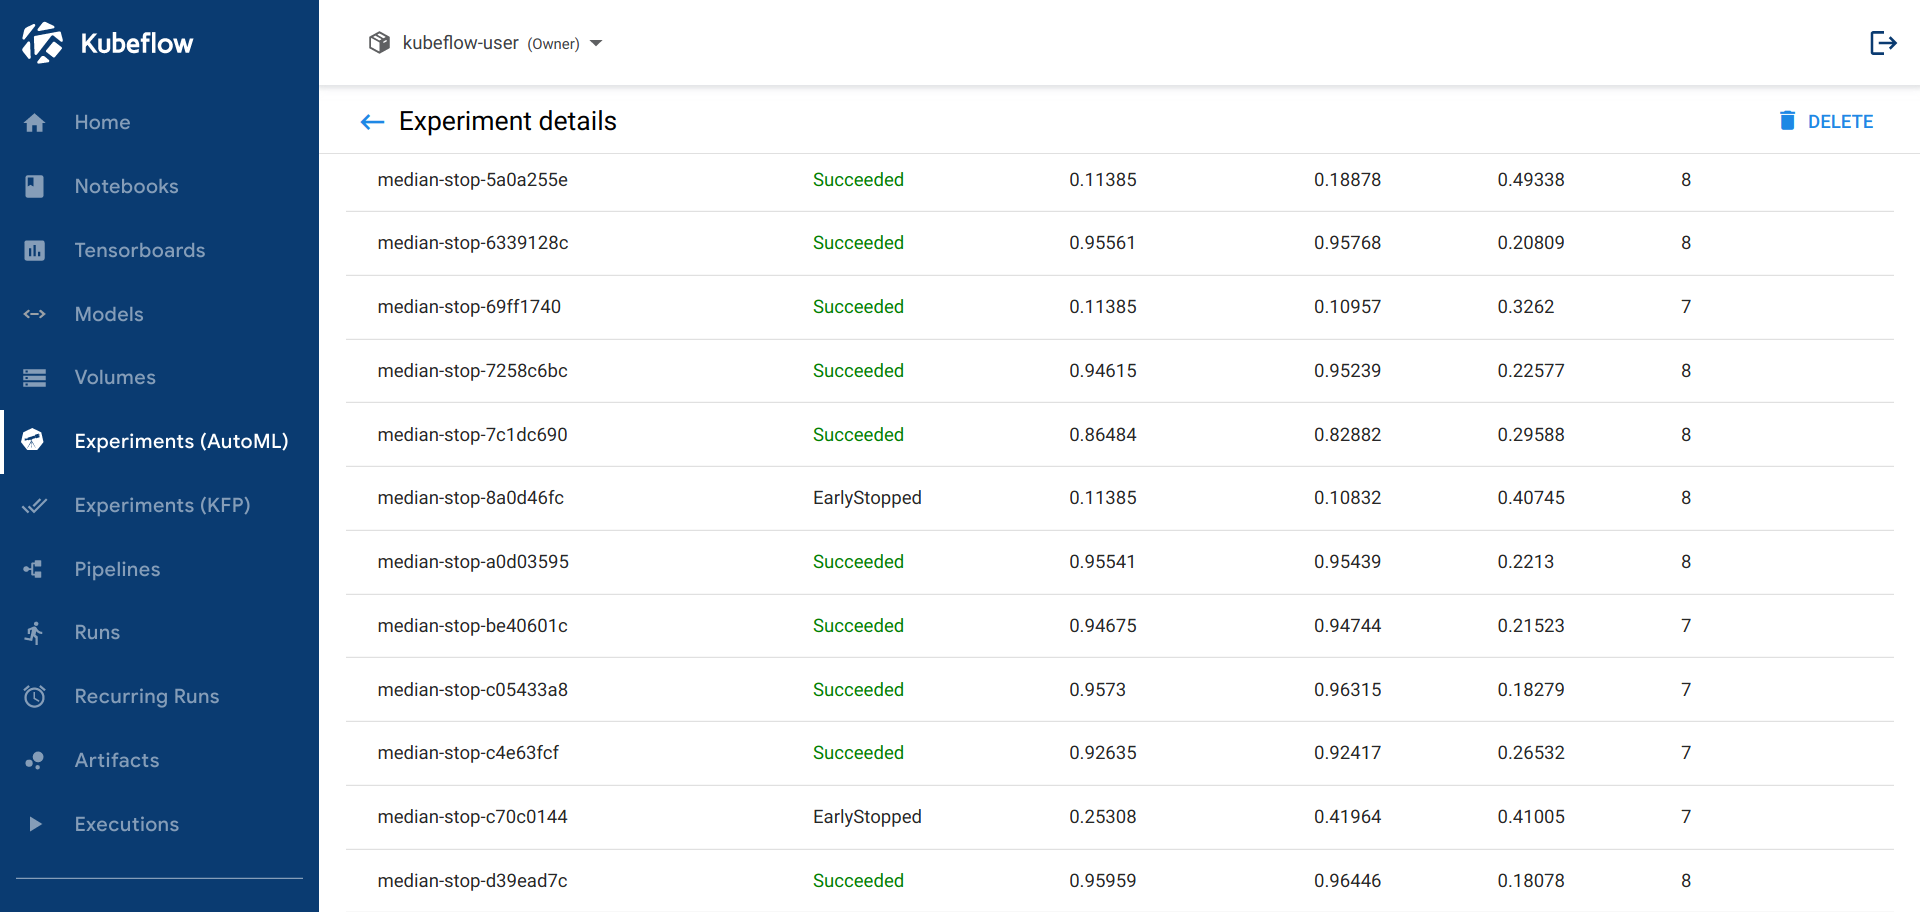
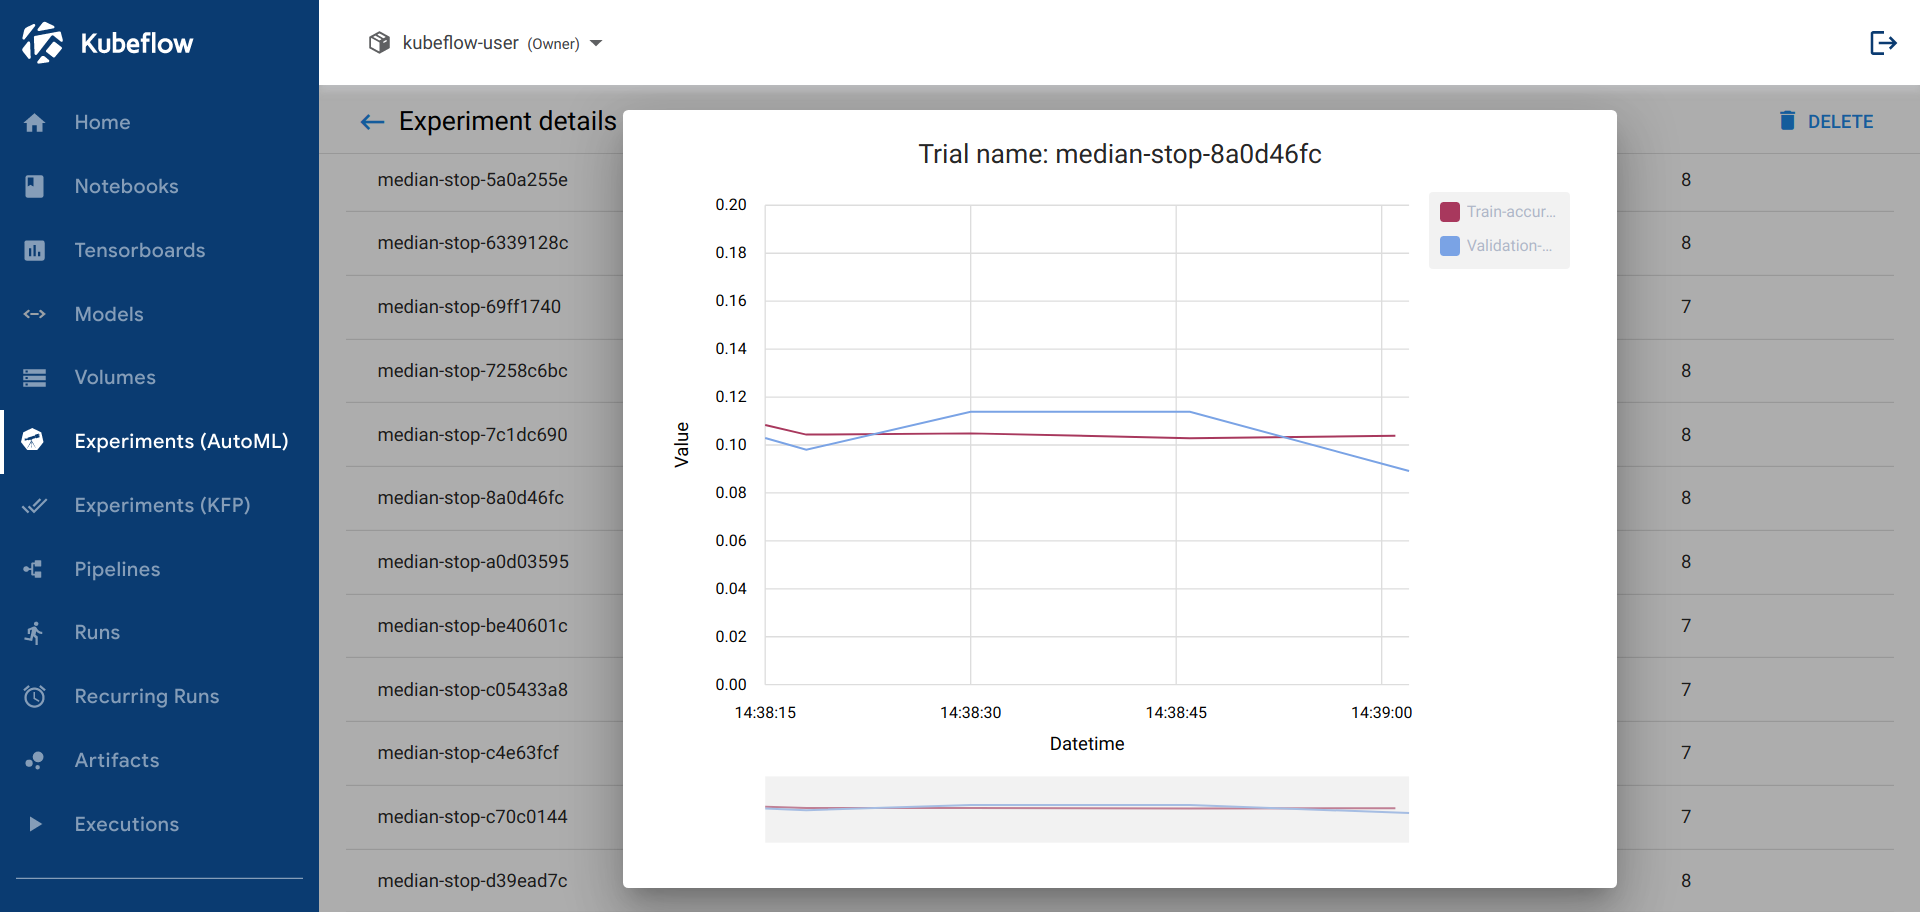
You can click on the early stopped Trial name to get reported metrics before this Trial was early stopped:
Next Steps
Understand how Katib metrics collector works.
Learn how to use early stopping within Katib Experiments
Feedback
Was this page helpful?
Glad to hear it! Please tell us how we can improve.
Sorry to hear that. Please tell us how we can improve.